

Our short-term sentiment indicator is based on a proprietary quantitative methodology that extracts trader sentiment from a multitude of current and historical transaction data. It is updated on a daily basis and tracks market sentiment in real time, while leading the market movements.

• Black line: Sentiment indicator.
• Red line: S&P 500 Index.
• Peak of the crisis (largest stock market loss): October, 2008.
• The sentiment indicator predicted this:
strong downward movements (reductions in the indicator value) in August and September, 2008 (blue circle), well ahead of the market crash.

• Black line: Sentiment indicator.
• Red line: S&P 500 Index.
• Peak of the crisis (largest stock market loss): February-March, 2020.
• The indicator predicted this: strong downward movements in December and January, 2020 (blue circles), well ahead of the market dip.
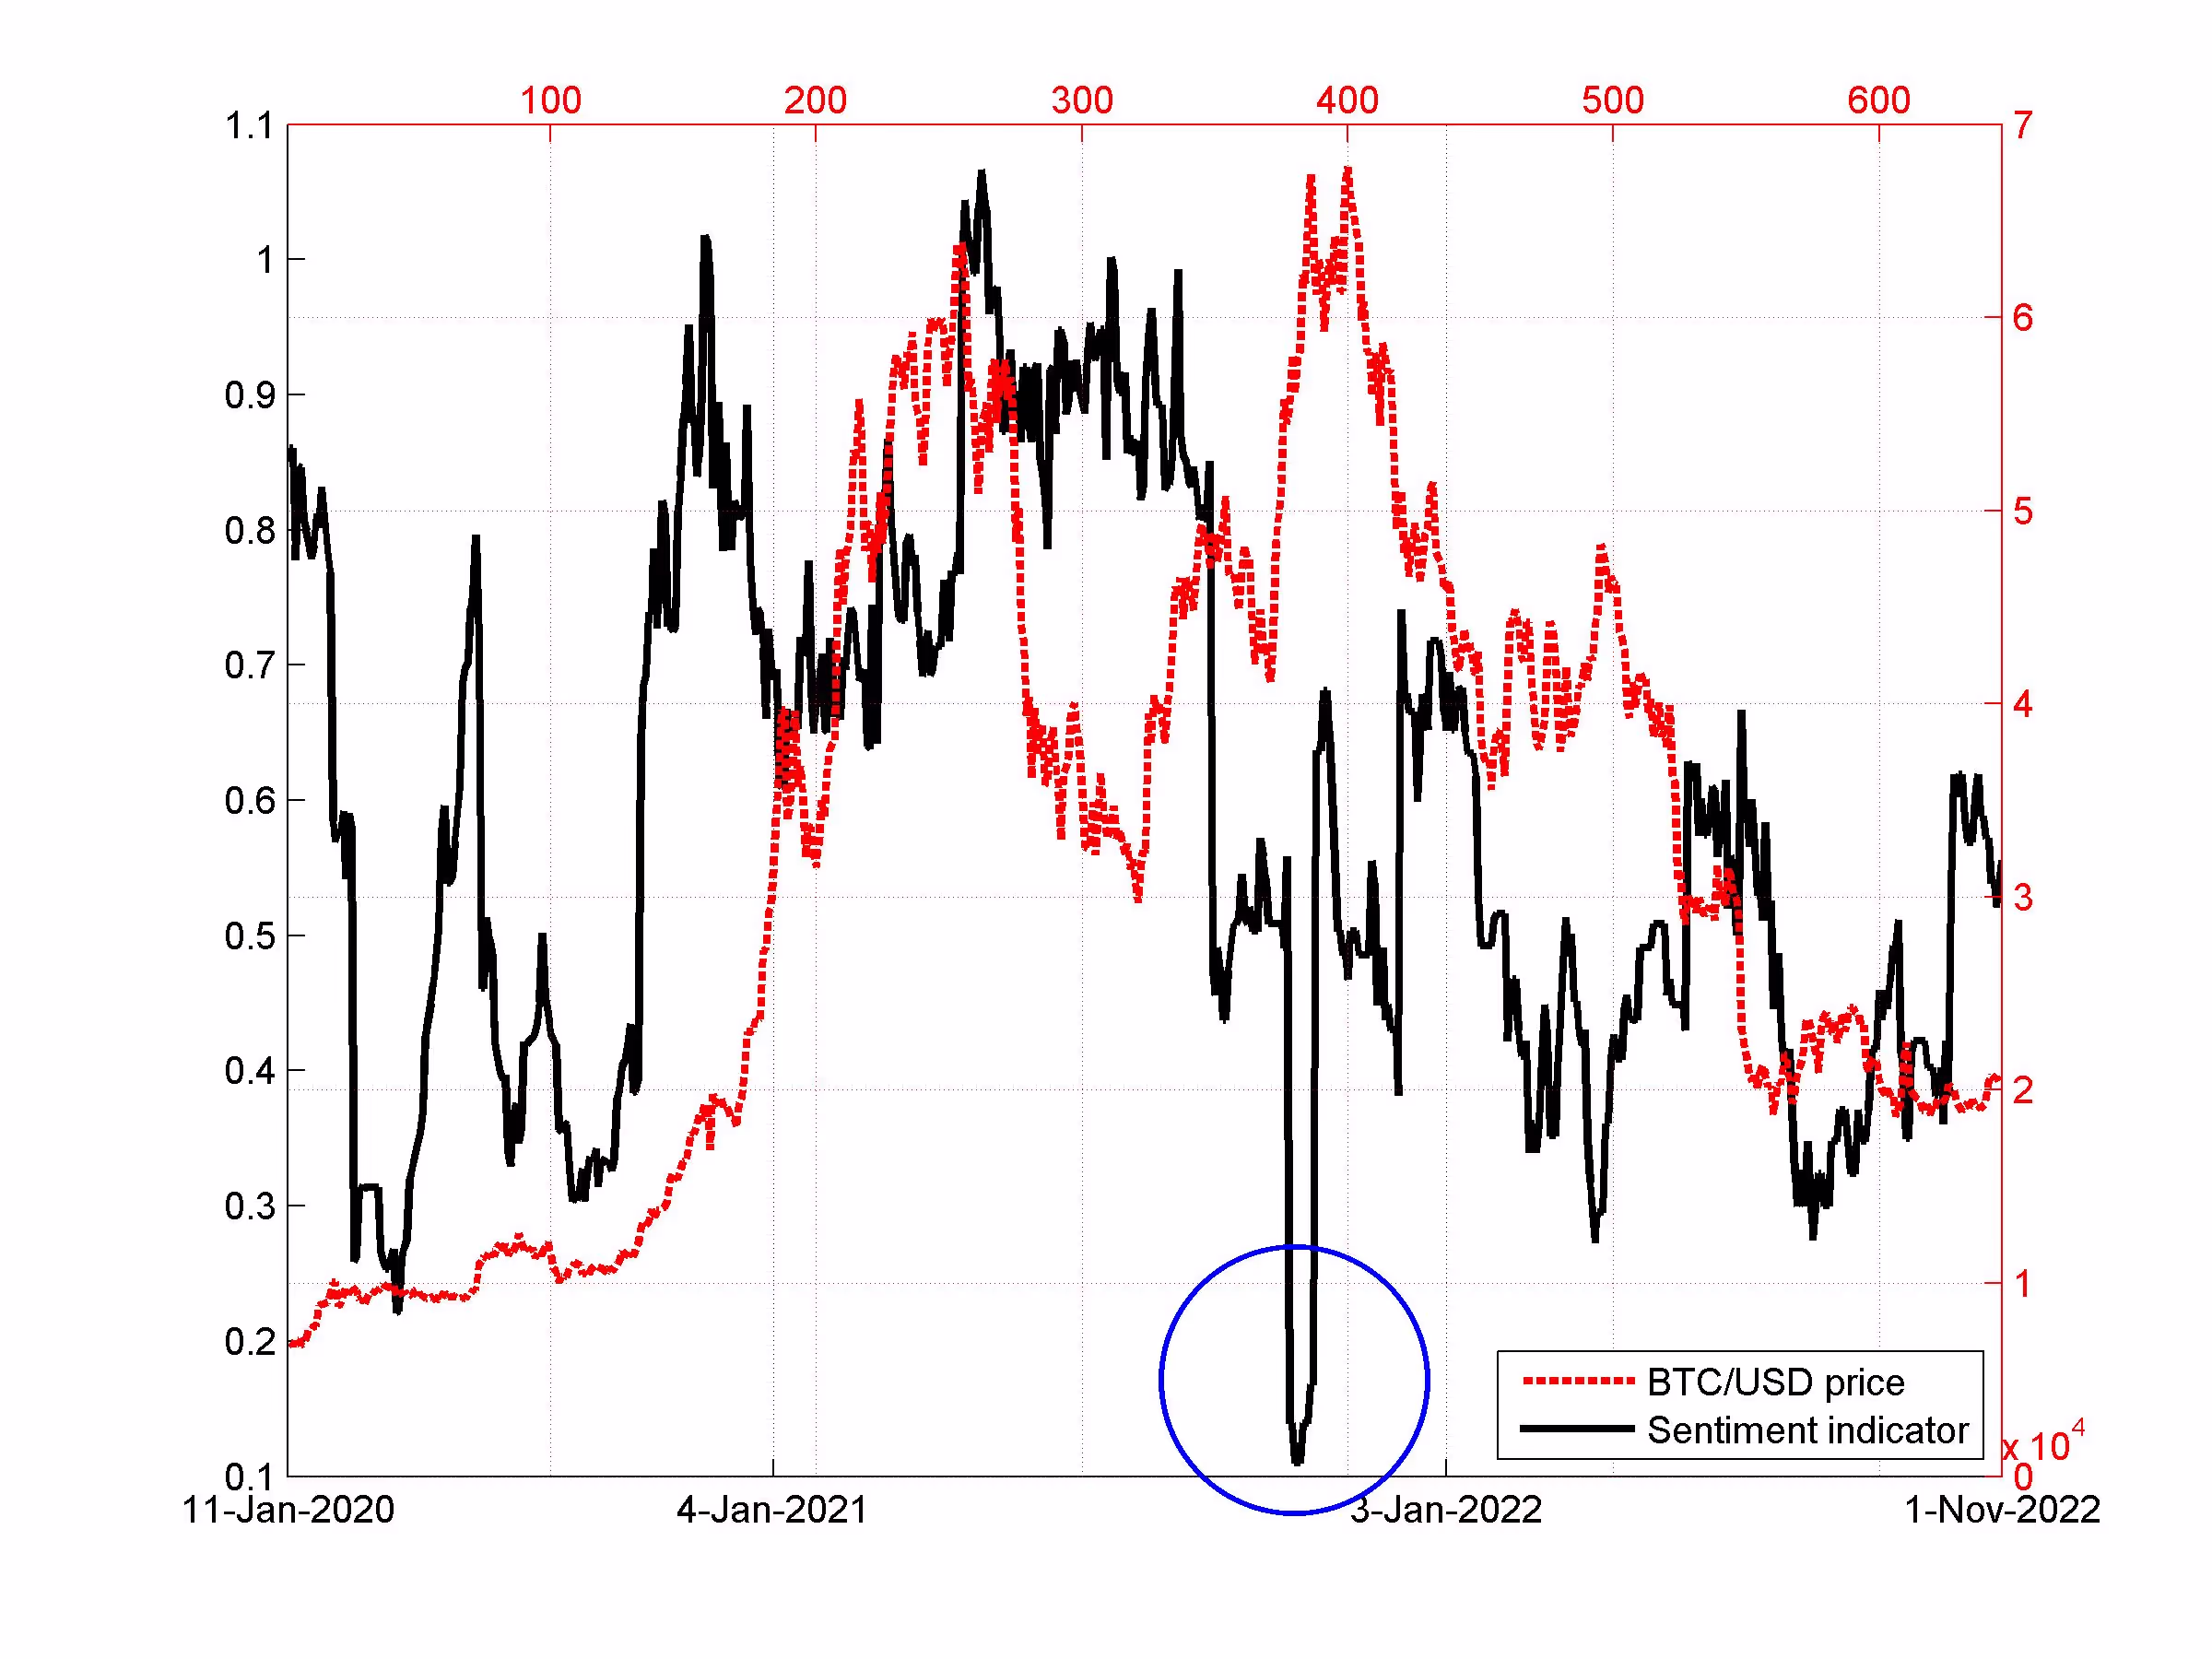
• Black line: Sentiment indicator.
• Red line: Bitcoin price.
• Cryptocurrency market crashed in 2022.
• The sentiment indicator predicted this: strong downward movements (reductions in the indicator value to almost zero in December, 2021 (blue circle).